Analytics Dashboard
Structured presentation of performance, allocation, and position data.
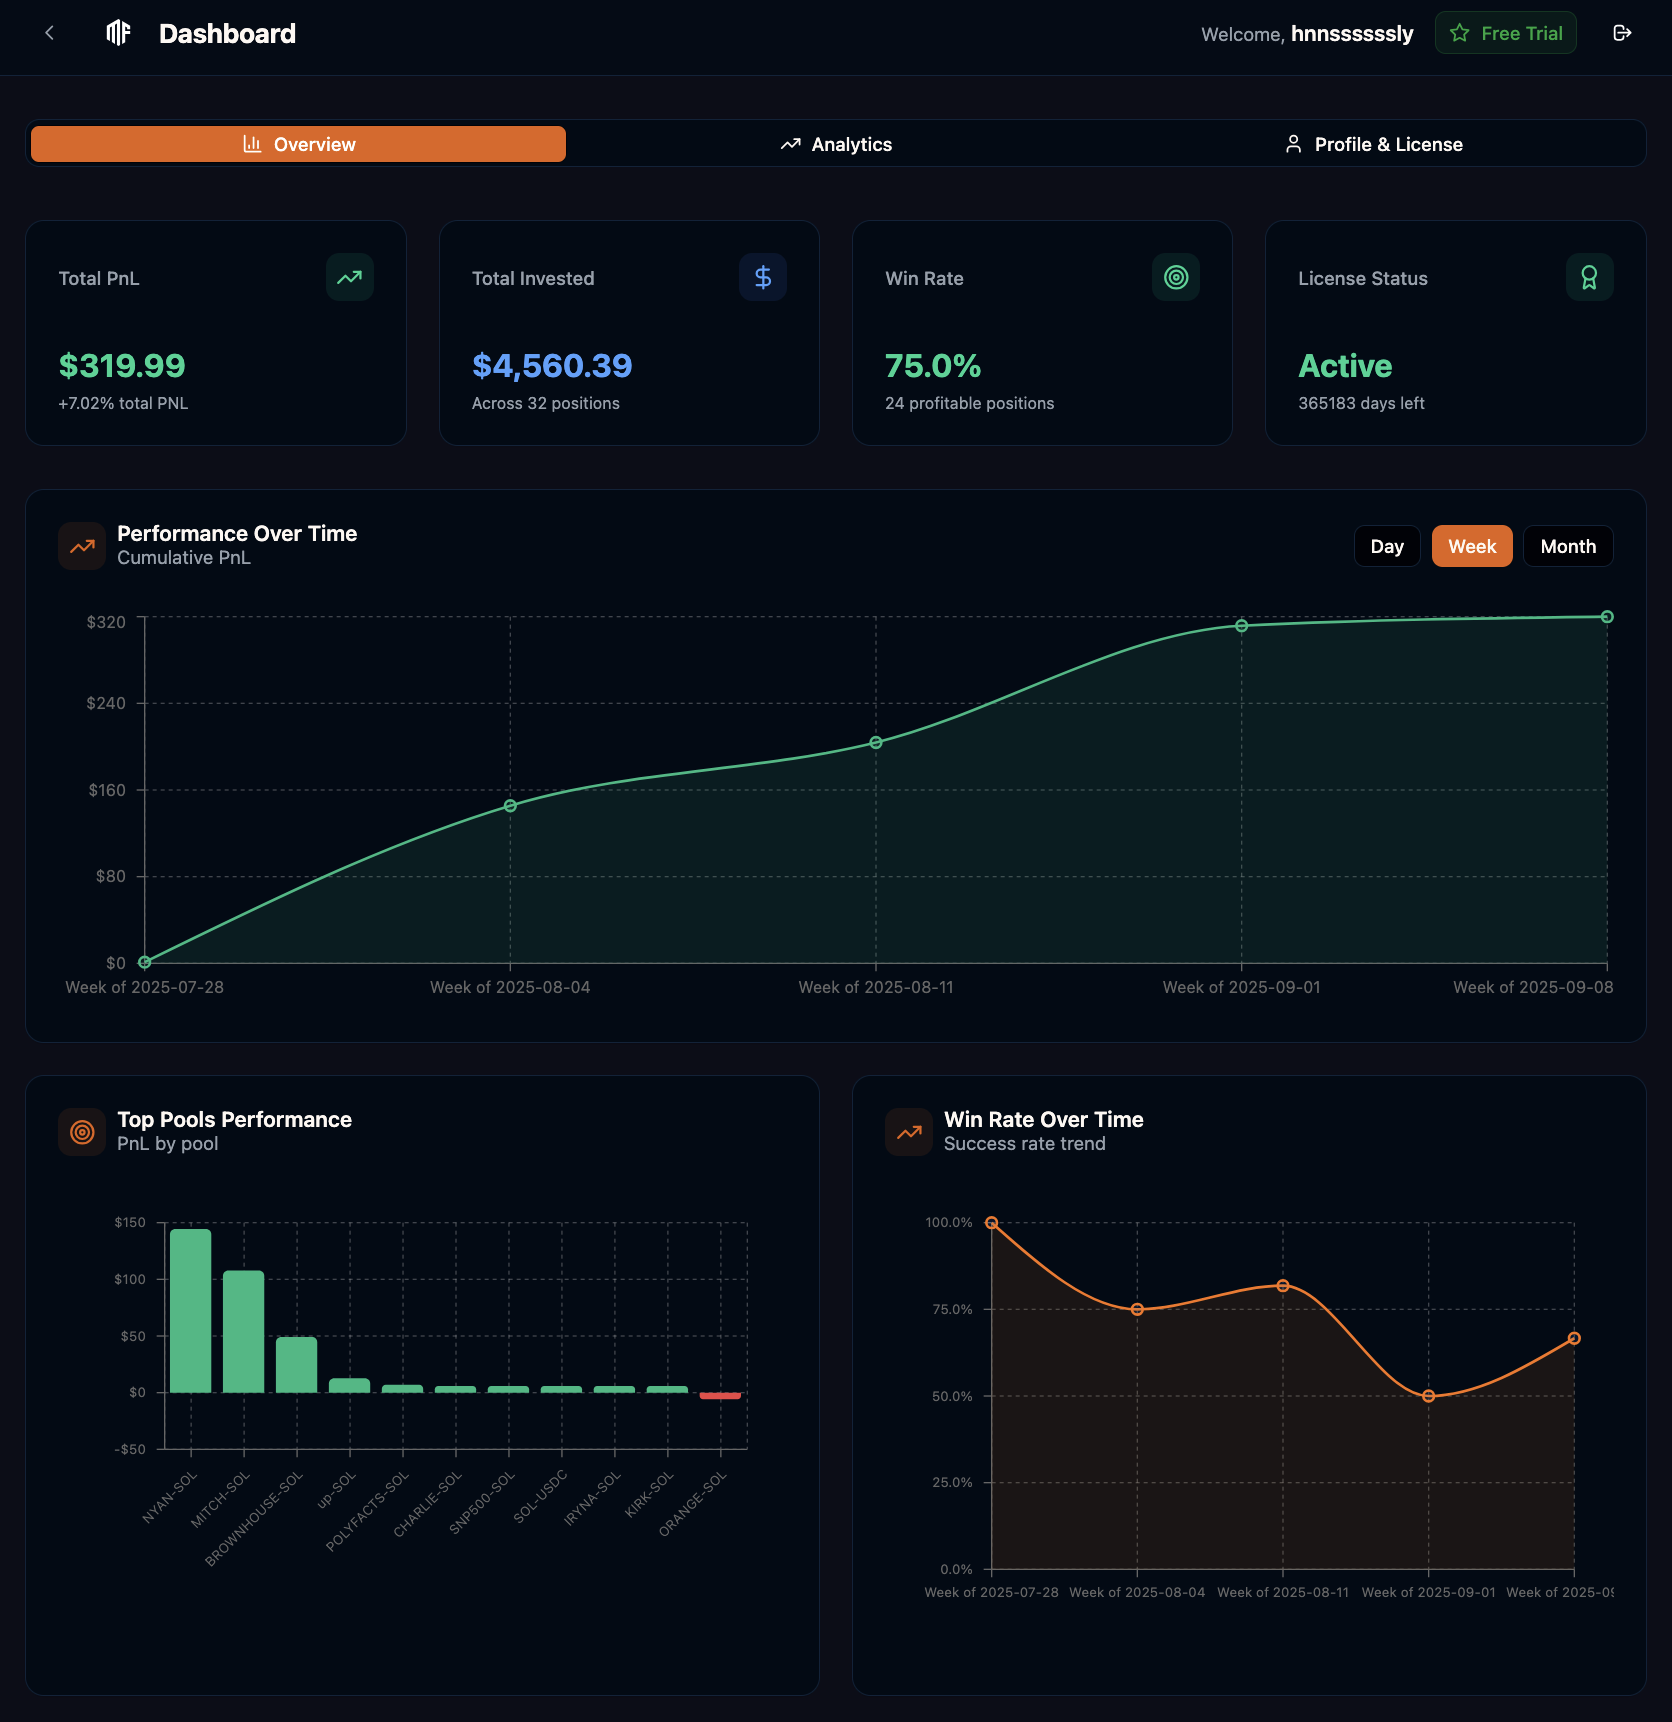
Headline Metrics (Cards)
- Total PnL — Aggregated realized + unrealized profit/loss net of fees.
- Total Invested — Aggregate principal currently deployed across active positions.
- Win Rate — Percentage of closed positions with positive PnL.
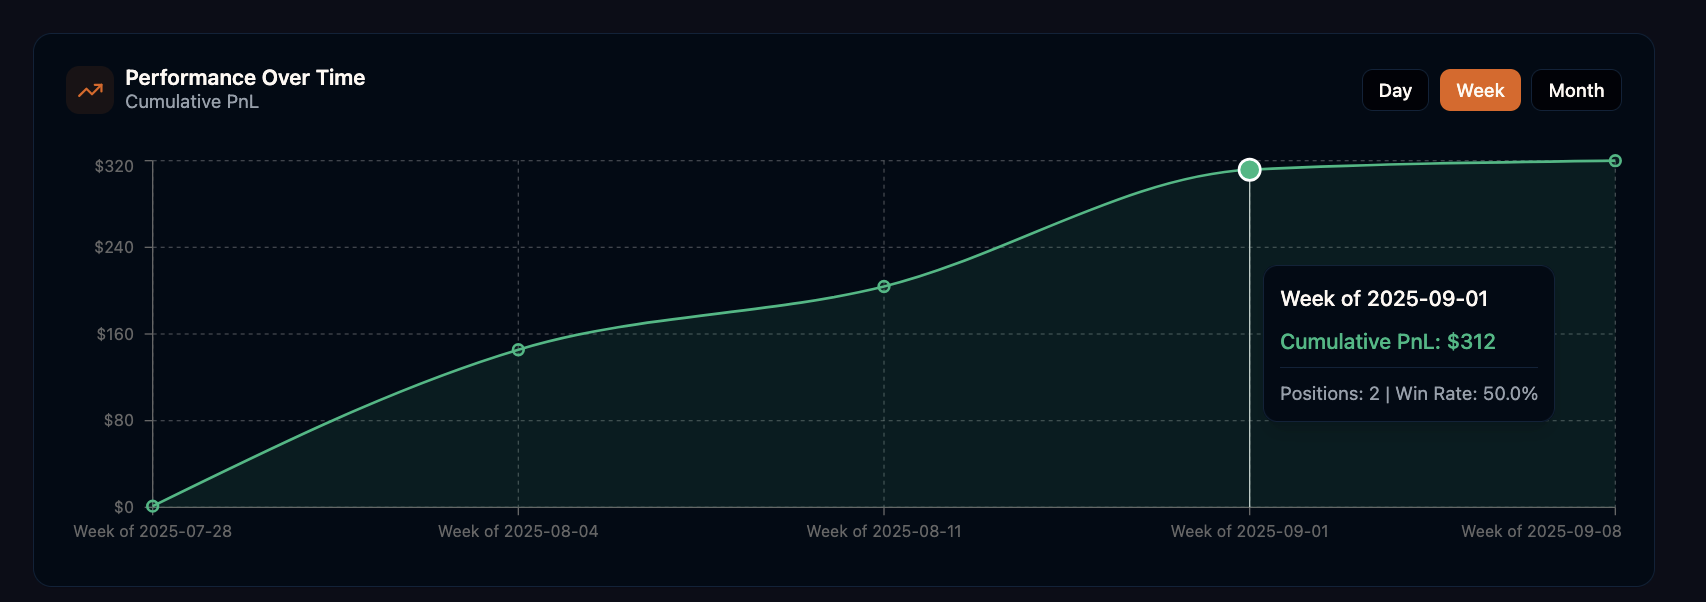
Trend & Distribution Charts
Cumulative PnL (Day / Week / Month)
Line series of cumulative PnL over the selected aggregation interval.
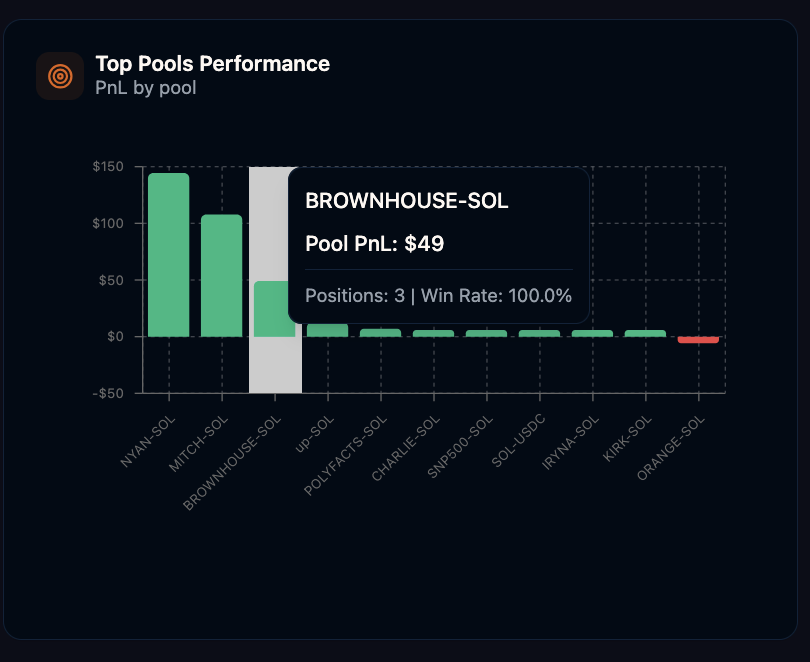
Top Pools Performance
Bar chart of per‑pool PnL contribution ranked largest to smallest.
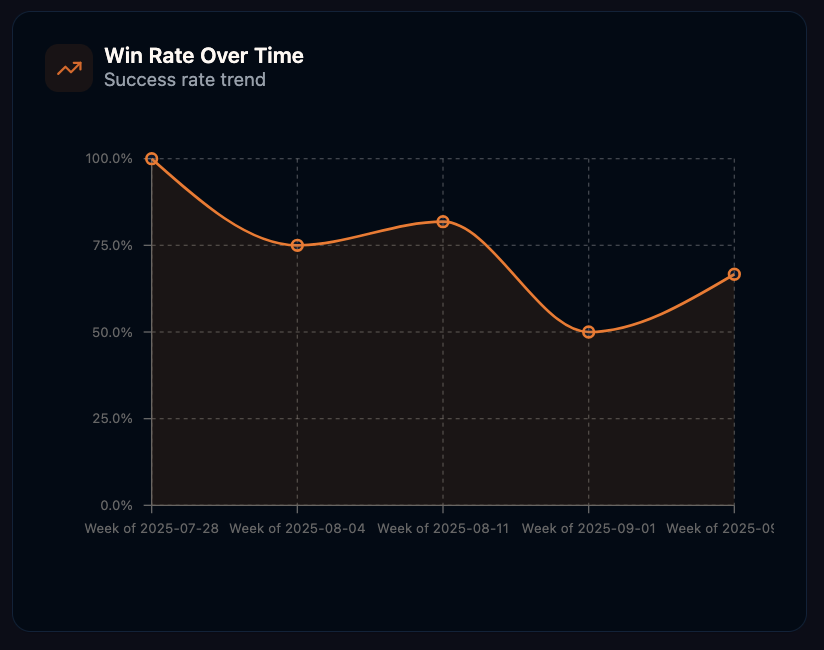
Win Rate Over Time
Time series of Win Rate across aggregation buckets.
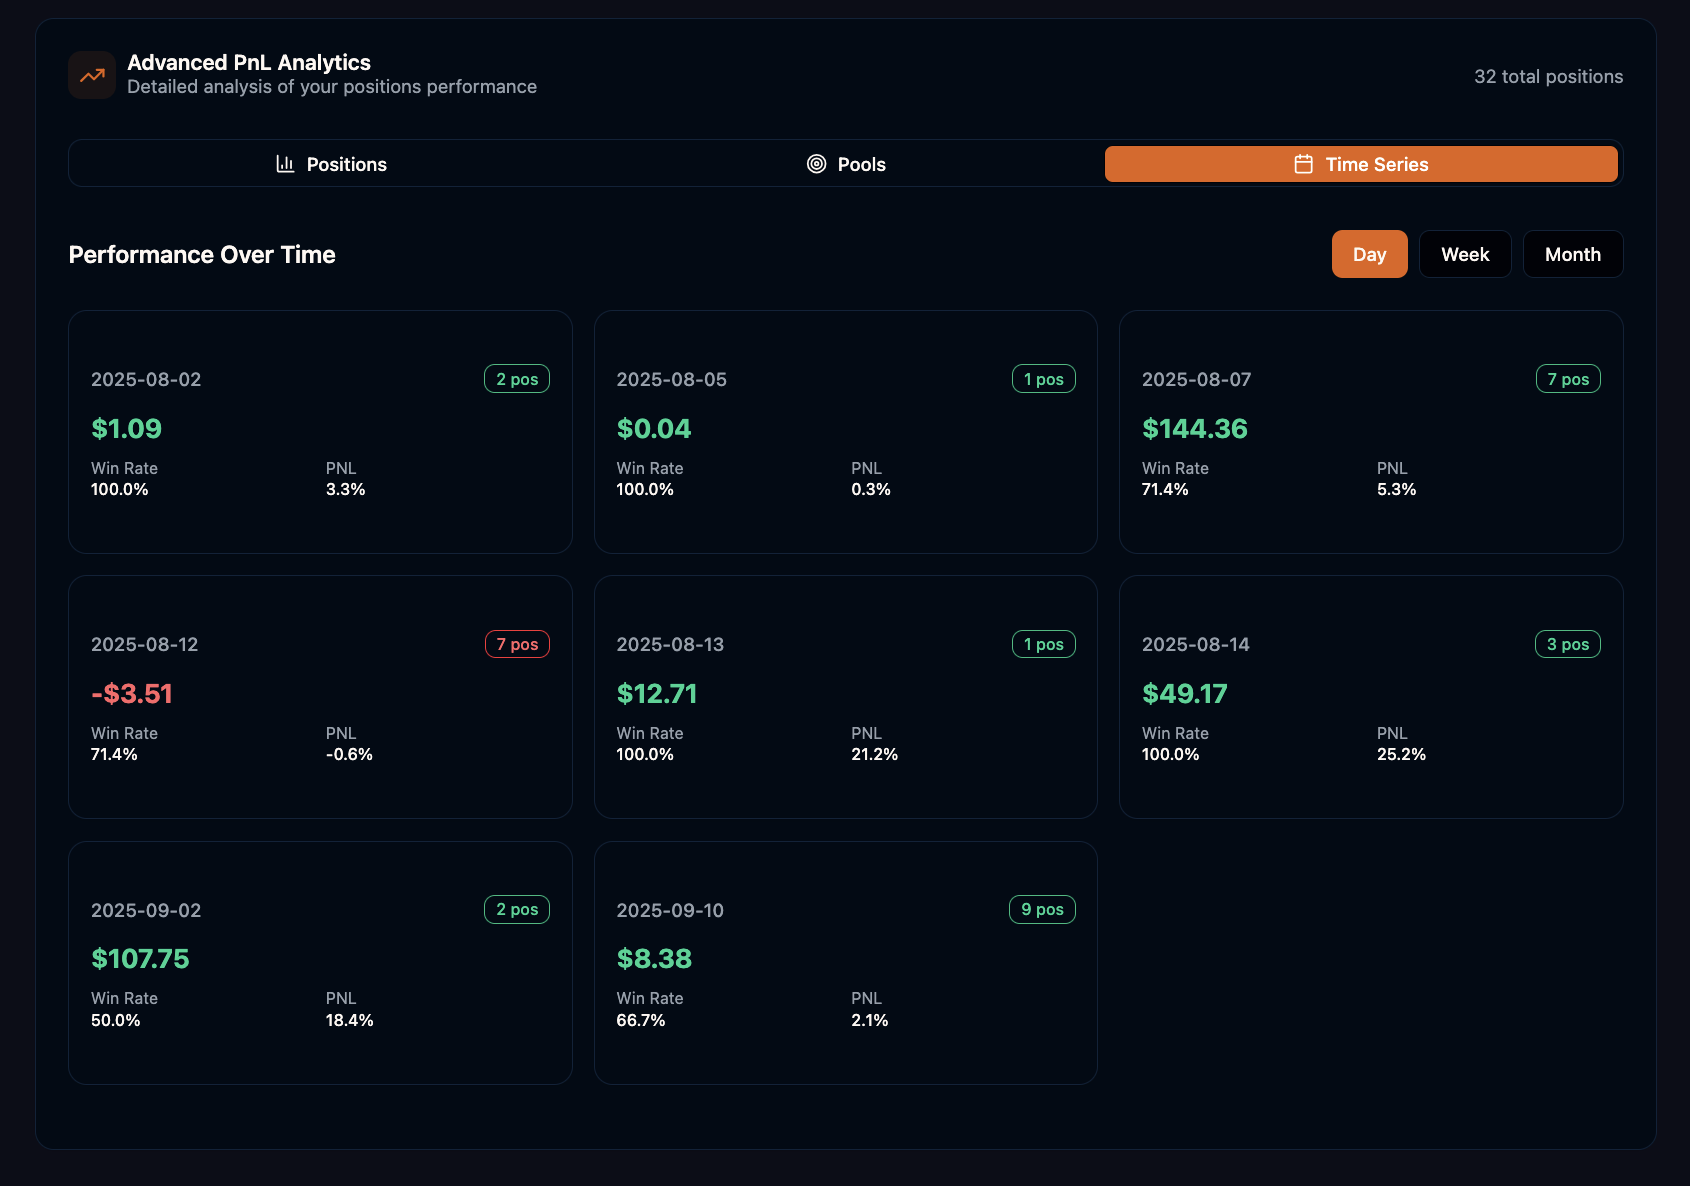
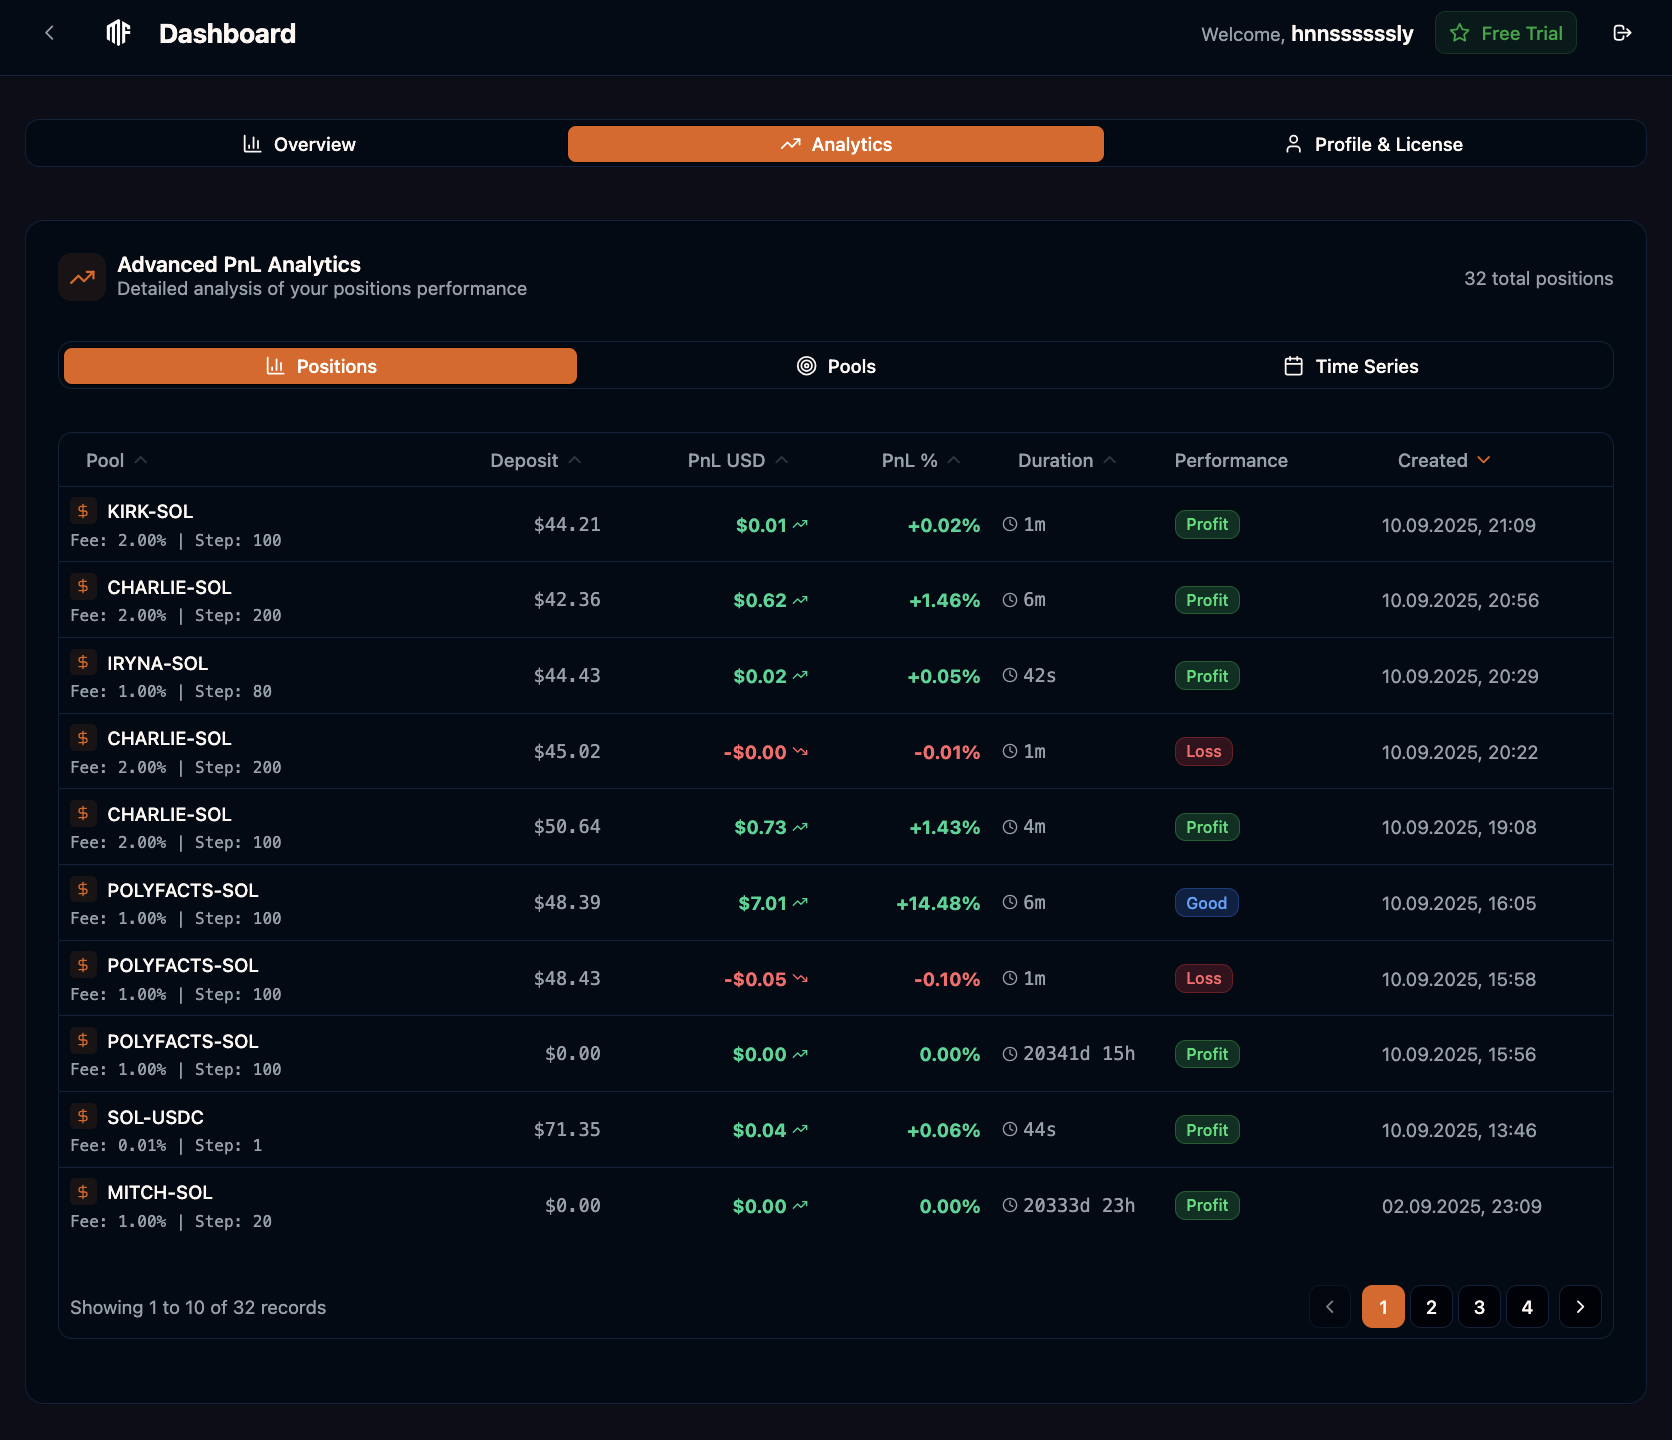
Advanced PnL Analytics Section
Tabs: Positions | Pools | Time Series.
Positions Table (Per Position Snapshot)
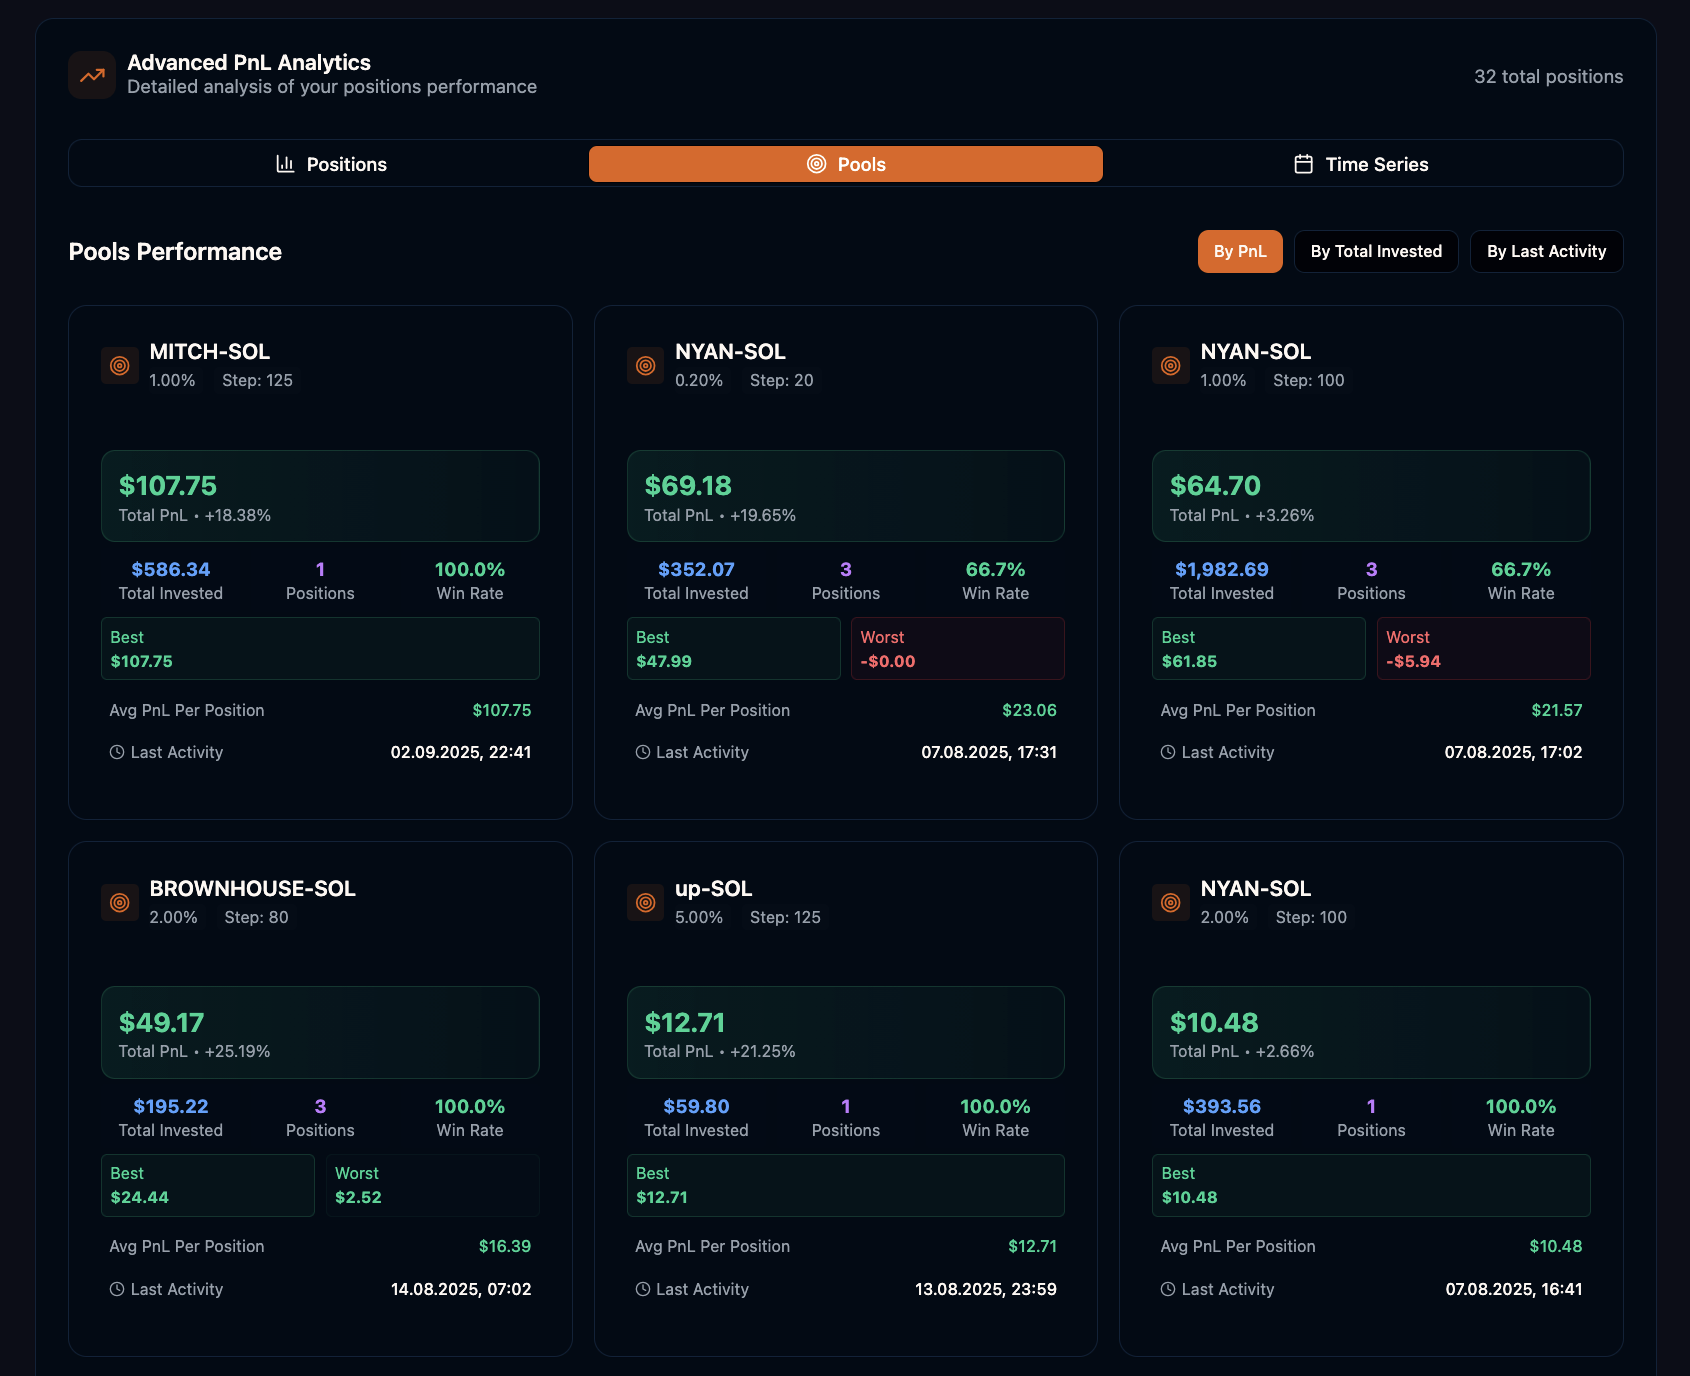
Pools Tab (Aggregated Per Pool)
Time Series Tab
PnL, Win Rate and Fees rendered over chosen interval (Day / Week / Month).